ENERGY INSIGHTS · Forecasting
Why forecast solar output in 15-minute intervals?
Planning a day in 96 slots and preparing for forecast error.
Forecasting solar output is a starting point for coordinating surplus energy. Storage and charging cannot be planned well without knowing when and how much energy may be available. This article explains the resolution used in NanoGrid AI's public design, not a claim of forecast accuracy.
15-minute forecasts: 96 slots in a day
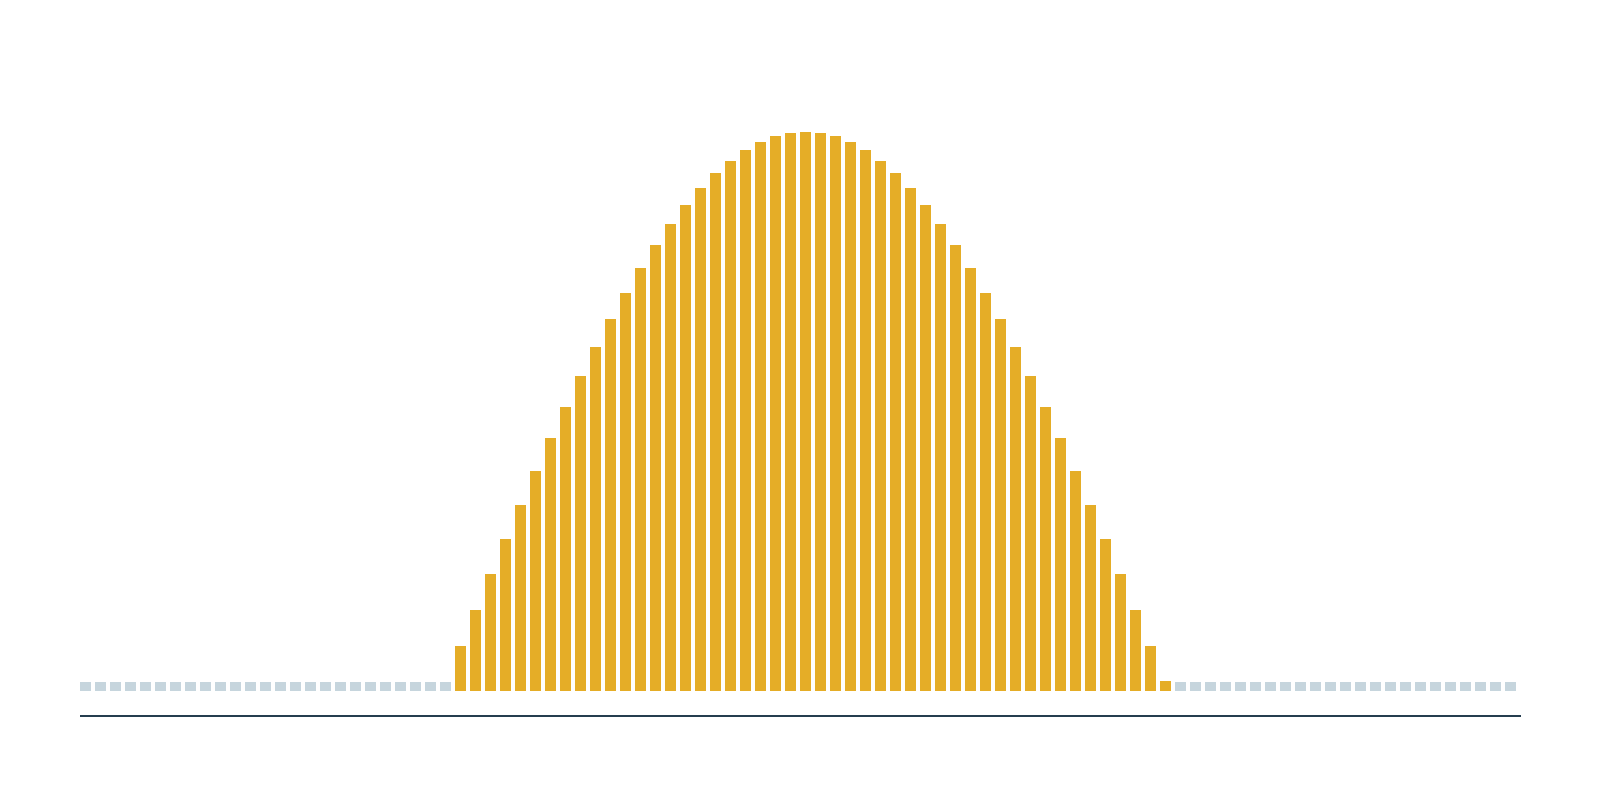
NanoGrid AI represents forecasts and operating plans in 15-minute intervals, dividing a day into 96 slots.
Clouds can change generation quickly. A finer planning interval than an hour can help coordinate charging and battery use, although a 15-minute interval still cannot capture every fluctuation. EV charging and V2G plans use the same 96-slot timeline.
Demand forecasts belong on the same timeline

Generation alone is not enough. Expected consumption must also be considered to identify periods of surplus or shortage.
Demand, solar, batteries and EV charging or discharging are therefore aligned to the same 15-minute intervals. Matching timestamps supports comparisons at villages, depots and charging sites.
Forecasts can be wrong, so compare them with measurements
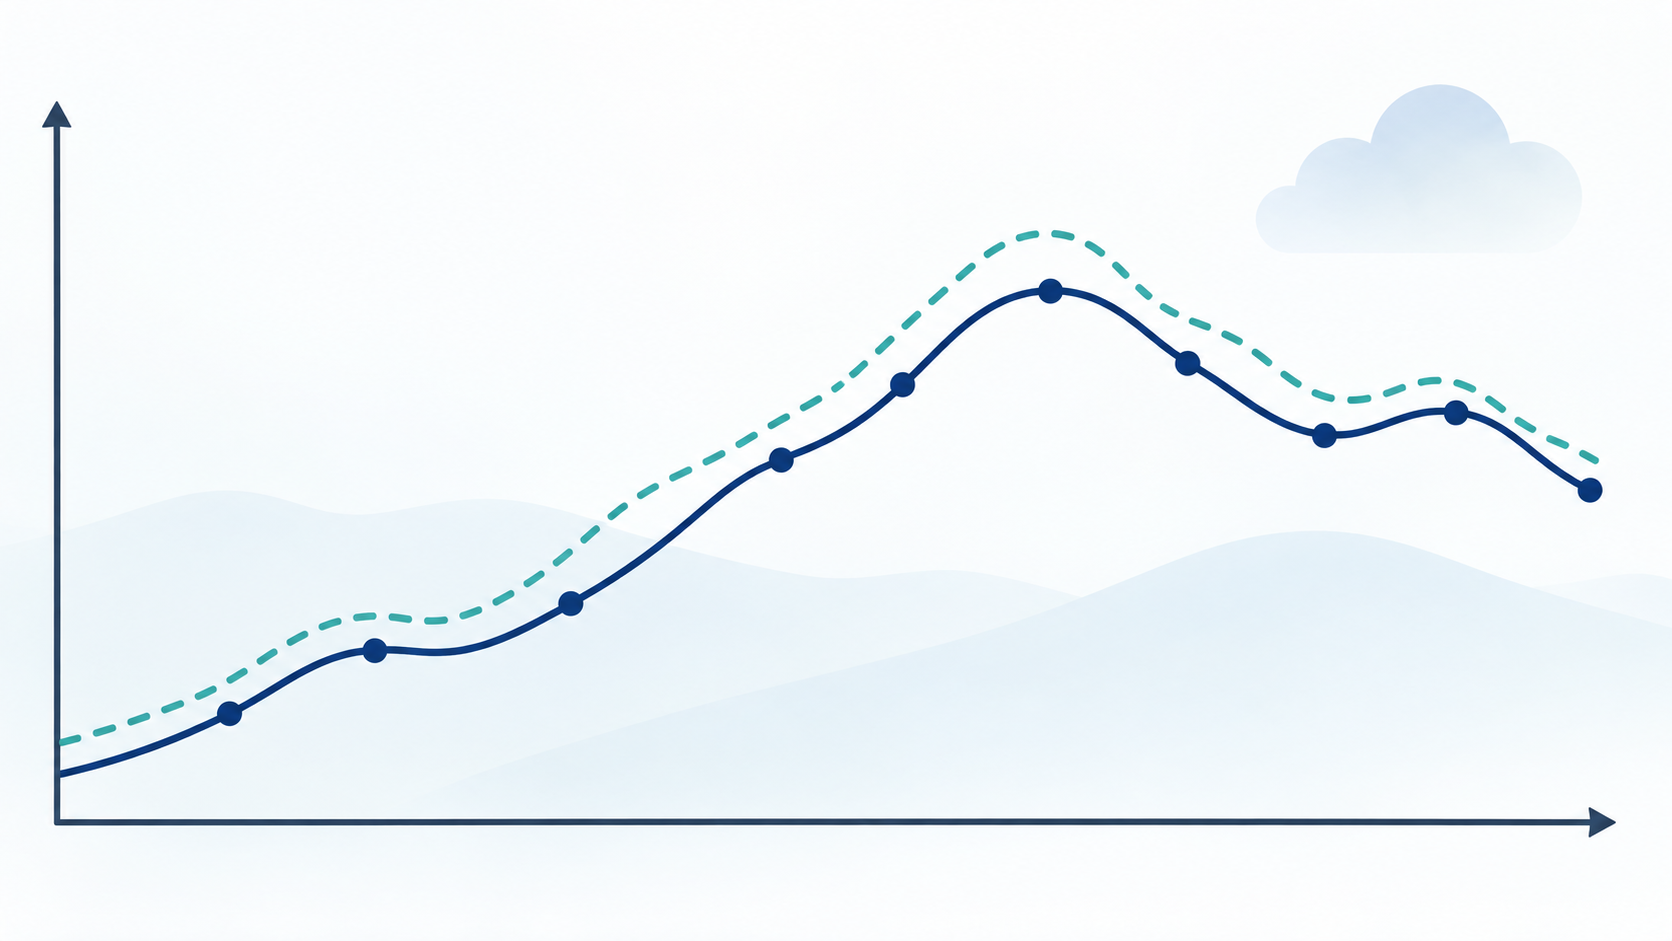
Actual measurements are accumulated and compared with forecasts. The differences can then be documented as evidence for further analysis.
The public description explicitly notes that different tariffs, prices or forecast outcomes change the results. Keeping forecast error visible is part of assessing the system; it does not guarantee later accuracy.
Applying the idea at home

At home, weather forecasts can help identify likely sunny periods for flexible appliance use, subject to safe appliance operation.
If your inverter provides time-based generation data, recording it over a week can help show when your panels produce most. The record describes your own conditions rather than a universal result.